Hacking on/debugging your window manager
Recent frustrations with the more traditional desktop environment I have been using have led me to switch to a simpler window manager. This post isn’t so much about what I learned about about window managers and the X window system, but how I set everything up so I could debug a window manager and step through it line by line. Maybe it is just because I am not even close to a GUI programmer, whether for the desktop applications on any platform or the web, so I am not familiar with how the ‘pros’ to it, but I did not find it to be particularly straightforward. I am sure someone more well versed in this field than me can explain why what I am doing is ridiculous or how there are much better ways.
A quick tangent: there are two well known programmers, both of whom I admire immensely, with very different documented views on debuggers. Linus Torvalds stated “I don’t like debuggers. […] I do not condone single-stepping through code to find the bug. I do not think that extra visibility into the system is necessarily a good thing.” On the other hand, John Carmack stated “A debugger is how you get a view into a system that’s too complicated to understand. Anybody that thinks ‘just read the code and think about it’, that’s an insane statement”. At the time of writing, Linus Torvalds’ made his statement more than 20 years ago, whereas John Carmack’s statement is relatively recent. Perhaps Linus’ view has since changed, but I happen to agree with John Carmack on this one. When I want to understand a program, in addition to reading the code, I like to step through line by line and observe what is happening, which is rarely clear from just reading the code of anything but the most trivial programs. I mention these quotes because I have had some recurring bugs with KDE Plasma with X, which I’ve used as my desktop environment for at least the past 5 years. After randomly logging in and finding my desktop basically unusable a couple of times in the past few months, I decided it was time for a change, and that I didn’t want to use a massive, hard to debug desktop environment again. So, I decided to switch to dwm full time, and I was resolved to have at least a rough understanding of how it worked and how I might debug it so that I wouldn’t be completely stuck in the event that I experienced an issue in the future.
The first hurdle you will have to jump through is that you cannot simply call
gdb on dwm from your graphical desktop environment/window manager. You will
get an error “another window manager is already running”. So you will actually
need a nested X server for this process; that’s where
Xephyr comes in. For instance, I can
run startx ./xinitrc_test -- /usr/bin/Xephyr -screen 800x600 -br -reset
-terminate :1 2> /dev/null & and get a new dwm instance in an independent
window, while running dwm as my main window manager. Note that you can press
Ctrl+Shift to lock your mouse into the Xephyr window. Now, how can we attach to
this new dwm process as soon as it starts? My first thought was to see if
gdb had some way to preattach to a named process. This does not seem to be
a built in feature, but I came across this
gdb-helpers repo, from one of the gdb
developers, that adds a gdb function called preattach by means of the
SystemTap program. SystemTap is not
included in my distribution’s package manager, so I built SystemTap from source
and tried to use the preattach function in gdb. Unfortunately, I got a bunch
of errors, both indicating the SystemTap did not have the necessary kernel debug
information, as well as missing headers (even though I was able to build to
SystemTap binary). Dealing with the missing debug information meant I was going
to have to build a custom linux kernel that included the needed debug info,
something I wasn’t particularly excited to do. Given that I wasn’t sure that
SystemTap would work even with all the needed kernel debug info, I decided to
look for other options.
A simple hack was to modify dwm to add an infinite loop to the beginning of
main which I would then break out of manually after attaching to the running
process. Then, I could step through all of the initialization steps until the
window manager was running, and then add any other breakpoints to observe other
behavior as I used the window manager. The needed diff in dwm.c is:
diff --git a/dwm.c b/dwm.c
index 03baf42..77c2f4d 100644
--- a/dwm.c
+++ b/dwm.c
@@ -276,6 +276,17 @@ static Window root, wmcheckwin;
struct NumTags { char limitexceeded[LENGTH(tags) > 31 ? -1 : 1]; };
/* function implementations */
+
+static void
+dwm_debug()
+{
+ volatile int a = 0;
+ volatile int b = 0;
+ while(a == 0){
+ b = 1;
+ }
+}
+
void
applyrules(Client *c)
{
@@ -2137,6 +2148,9 @@ zoom(const Arg *arg)
int
main(int argc, char *argv[])
{
+#ifdef DEBUG
+ dwm_debug();
+#endif
if (argc == 2 && !strcmp("-v", argv[1]))
die("dwm-"VERSION);
else if (argc != 1)
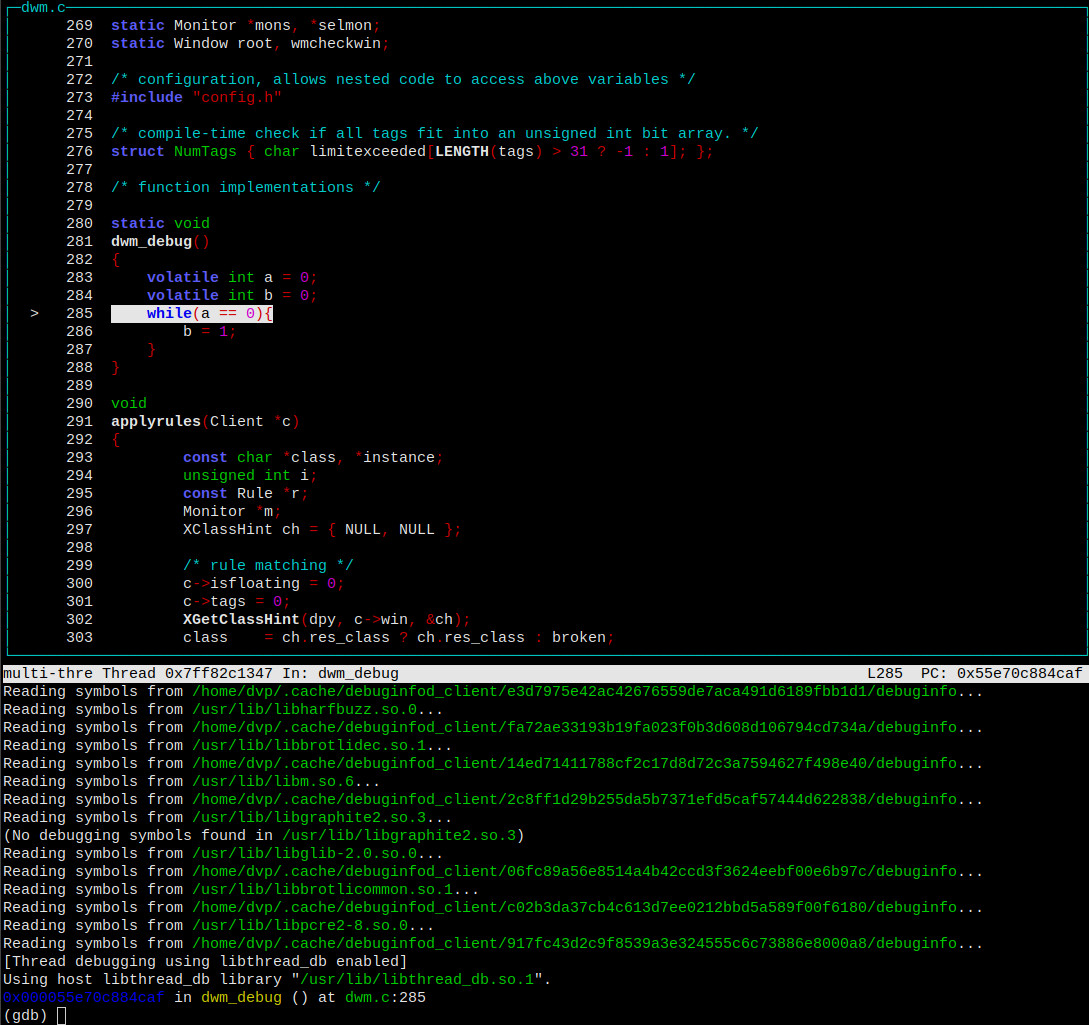
This adds a function dwm_debug that creates an infinite loop waiting for
a variable a to change; something that we will do manually in gdb. Note the
use of the volatile keyword to make sure your compiler does not perform any
sort of optimization that would prevent our ability to manually change these
variables from gdb.
In addition to the above change, we need to make a change to config.mk which
contains a commented out line with C flags that are apparently used for
debugging. When we want to debug dwm, we should uncomment this changed line:
diff --git a/config.mk b/config.mk
index ef8acf7..06c6c02 100644
--- a/config.mk
+++ b/config.mk
@@ -27,7 +27,7 @@ LIBS = -L${X11LIB} -lX11 ${XINERAMALIBS} ${FREETYPELIBS}
# flags
CPPFLAGS = -D_DEFAULT_SOURCE -D_BSD_SOURCE -D_POSIX_C_SOURCE=200809L -DVERSION=\"${VERSION}\" ${XINERAMAFLAGS}
-#CFLAGS = -g -std=c99 -pedantic -Wall -O0 ${INCS} ${CPPFLAGS}
+#CFLAGS = -g -DDEBUG -std=c99 -pedantic -Wall -O0 ${INCS} ${CPPFLAGS}
CFLAGS = -std=c99 -pedantic -Wall -Wno-deprecated-declarations -Os ${INCS} ${CPPFLAGS}
LDFLAGS = ${LIBS}
Now, when building dwm with those flags, we can step into our dwm_debug
function, manually change the variable a, and step through the whole program.
I wrote a convenience script to help with starting the debug process (note that
my xinitrc_test simply contains exec dwm):
#!/usr/bin/env sh
# Make sure to build dwm with the commented out CFLAGS that include -g
# and add -DDEBUG to those flags.
startx ./xinitrc_test -- /usr/bin/Xephyr -screen 800x600 -br -reset
-terminate :1 2> /dev/null &
sleep 5
dwmpid=$(pgrep -n dwm)
sudo -E gdb -p ${dwmpid}
At this point, gdb will start up and be in the infinite loop, which you can
break out of via set var a=1.
So, so you can start stepping through all the initialization steps, and set
breakpoints in whatever other functions you wish. Note that you will have some
difficulties, if you, i.e., wish to debug X events directly via something like
watch ev in the main event loop. Everything will just lock up once you catch
an event change. This seems to be related to a common issue when debugging
X applications, see
here: “It’s
very difficult to debug the X server from within itself; when it stops and
returns control to the debugger, you won’t be able to send events to the xterm
running your debugger.”. I may eventually try to figure out how to fully catch
X events without locking up when returning to the debugger (perhaps that will
require 2 computers), but I have found this method useful for understanding my
window manager in the meantime.